Lesson 3.3 Functions with Line Graphs
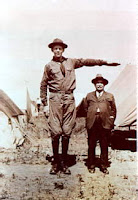
So far we have seen that functions can take on different forms such as an equation, a table or a graph. In lessons 1 and 2 the “guess my rule” function machine metaphor helped to show the connection between the rule and the table. Lesson 3 graphing functions (more specifically, linear equations) is the focus. As usual, Mr. Jacobs likes to present a motivational activity to start and he uses in Edition 3 the story about Robert Wadlow who at one time was the tallest man in the world to show the relationship between age and height. There is a marvelous website about Mr. Wadlow at http://www.altonweb.com/history/wadlow/ which is a fascinating read. Note : The word rule is used interchangeably with equation and even sometimes with function. This can cause confusion because a rule doesn’t always have to be an equation and not all equations are necessarily functions depending on how it’s defined. For example a mathematical rule (which is what we are talking about here) could be an ...