Posts
Lesson 3.6 Interpolation & Extrapolation - Guessing Between and beyond
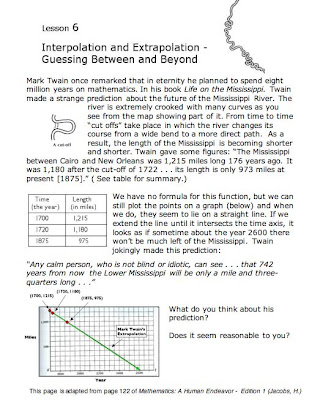
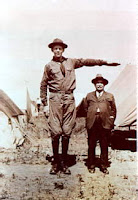
Something that your math teachers may have left out when teaching about graphs is that graphs tell stories. And it's the stories that make the math more interesting. In lesson 3.6 Mr. Jacobs (1) tells the story of Mark Twain’s prediction about how the length of the shrinking Mississippi River will end up. Read the page on the left. (Click on it for a larger image.) Back in 1992 I worked with an 8th grade teacher who told this story of Mark Twain's prediction to her students and asked them if what he said was plausible. I captured that part of her lesson on video. Here's a 5 1/2 minute clip. Notice how the teacher responds when the first girl supports Twain's prediction. As you will see her goal was to keep the discussion open without judging the student's response. The quality of the video is not great, but the audio captures it well. Here's the cover of the June, 1966 Scientific American journal showing an aerial view of the "shrinking" Mis...
Globs Contest meets Parabolas (Lesson 3.4)

This is the glob array I posted for the contest on 10/31/08 and here is my video that describes one solution using linear equations. In order to get the highest score possible you need to to maximize the number of globs you hit with each equation. I was hoping to get 5 globs with one and I came close with my first shot, but it missed (1,-1). The same was true for shot #2. Here’s all 5 of my shots. (I made the figure below with Geometer’s Sketchpad.) So I managed to get 37 points. I’m not sure that I can do better using linear equations. But what if could use parabolas? Mr. Jacobs introduces us to parabolas in lesson 4. He defines it as the graph of y equals x squared. In set 1 he explores the patterns that help us to move the parabola along the y axis and also how to draw it “upside down” by making the coefficient of the x-squared term negative. In the next video clip I describe more about graphing parabolas. Here’s the three parabolas I used to get my sco...
Halloween Globs Challenge

Here is the Glob array you will use to try to get the best possible score for this year's Halloween Globs challenge. Here's what you do: 1. Download the score sheet for this array. 2. If are using the Green Globs program download the game #2 file (PC or Mac). 3. Submit the equations used and a user name in an email to globscontestcentral@mac.com by NOV. 7th. 4. Once your equations are received, your score will be tabulated and posted on November 8th at the Contest home site . An email with the URL for where the results are posted will be sent to you. I hope you give it a try. Let me if you need help. I can walk you through it. Best wishes, Ihor
Linear equations attack the green globs on Halloween!

In lesson 3.3 you learned about linear functions and graphs. As an extension of that lesson I thought it would be useful to try the Great Green Globs challenge because you will need to use the skills you learned in this lesson. And if you didn't learn them all that well, this will be a great opportunity to learn them a fun way. Now using the Globs program ($20 from greenglobs.net) is the best way to go, but you can still compete anyway. Try this practice game to find out what you will be doing in the contest. Here are the instructions: 1. Download the score sheet and print it out. 2. Watch my Youtube video clip (3:40) to get an idea of how to play the game. 3. Graph the function* and write down the equation as shown in the figure below. 4. Continue drawing and recording equations until all 13 globs have at least one line going through them. When finished send your list of equations in an email to globscentral@mac.com . I will enter your equations into the Globs program...
Everything You Ever Wanted to Know about Equations, Lines, Slopes, and Graphs but Were Afraid to Ask

The next lesson in chapter 3 of your math book is on graphs, lines, slopes, and equations. Why would you ever want to learn this you might ask? One very good reason is that in the very near future you will be participating in the Great Green Globs Contest and you will need to know all about coordinate geometry. You will learn by playing the Globs game either on the computer* (which is the best way) or with a printout of the score sheet along with a pencil and ruler. Green Globs: The Game (a description) Thirteen randomly scattered “green globs” are displayed on a coordinate grid. The goal is to "explode" all the globs by hitting them with the graphs of equations entered on the keyboard (or paper). The scoring algorithm encourages you to hit as many globs as possible with each equation in order to get the best possible score. The following lesson will help you to learn all you need to know about graphing equations to succeed in Green Globs. Have a good time, but don’t ...
Lesson 3.3 Functions with Line Graphs
So far we have seen that functions can take on different forms such as an equation, a table or a graph. In lessons 1 and 2 the “guess my rule” function machine metaphor helped to show the connection between the rule and the table. Lesson 3 graphing functions (more specifically, linear equations) is the focus. As usual, Mr. Jacobs likes to present a motivational activity to start and he uses in Edition 3 the story about Robert Wadlow who at one time was the tallest man in the world to show the relationship between age and height. There is a marvelous website about Mr. Wadlow at http://www.altonweb.com/history/wadlow/ which is a fascinating read. Note : The word rule is used interchangeably with equation and even sometimes with function. This can cause confusion because a rule doesn’t always have to be an equation and not all equations are necessarily functions depending on how it’s defined. For example a mathematical rule (which is what we are talking about here) could be an ...