Lesson 3.6 Interpolation & Extrapolation - Guessing Between and beyond
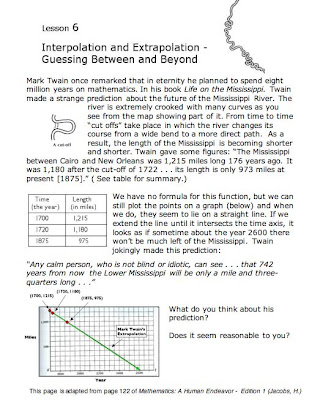
Something that your math teachers may have left out when teaching about graphs is that graphs tell stories. And it's the stories that make the math more interesting. In lesson 3.6 Mr. Jacobs (1) tells the story of Mark Twain’s prediction about how the length of the shrinking Mississippi River will end up. Read the page on the left. (Click on it for a larger image.) Back in 1992 I worked with an 8th grade teacher who told this story of Mark Twain's prediction to her students and asked them if what he said was plausible. I captured that part of her lesson on video. Here's a 5 1/2 minute clip. Notice how the teacher responds when the first girl supports Twain's prediction. As you will see her goal was to keep the discussion open without judging the student's response. The quality of the video is not great, but the audio captures it well. Here's the cover of the June, 1966 Scientific American journal showing an aerial view of the "shrinking" Mis